Solution to Project 2
For the text of the problem, see Project 2 page.
The Octave M-file
The M-file for Octave can be downloader/viewed here
The graph
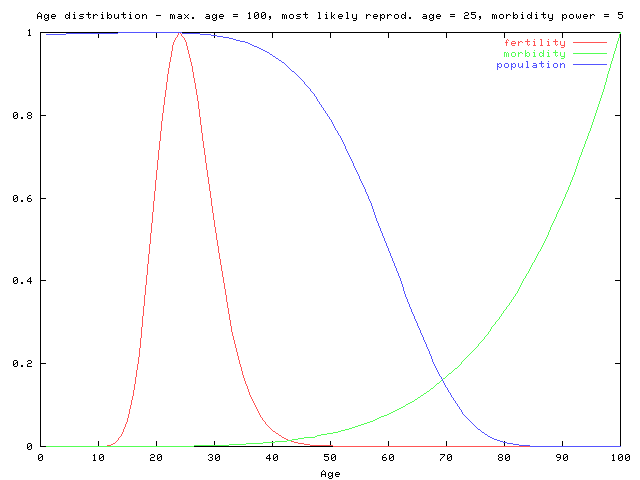
For the numbers used in the proplem, the stationary distribution is determined.
I plotted all three curves on the same plot, so that the shapes of the fertility and morbidity curves can
be seen.
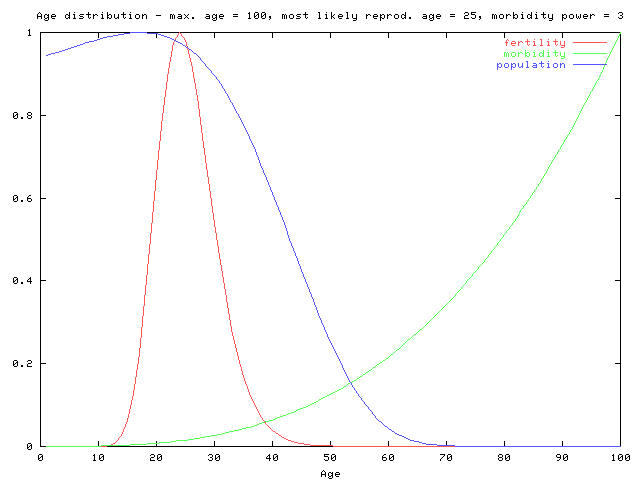
 Just for fun, let us consider a different combination of main parameters:

Marek Rychlik <rychlik@u.arizona.edu>
Last modified: Tue Dec 9 23:37:04 MST 2003


