Let us divide the population of human females into 100 groups, by age from 1 year to 100 years. As we know, the probability of having a female child varies, depending on the group.
Note that it is typical in population models to discard the male population from the model. One can simply assume that the male population equals the female population in the long run. The US. Census Bureau keeps track of the related fertility rate. Also, the mortality rate in each age group varies.Let us suppose that these rates remain constant. In the long run, they will determine the population distribution of females in various age groups. Given the fertility and mortality rates for females, determine the age structure of the population of females after many years from today.
Unfortunately, census data do not seem to directly provide the fertility and mortality rates for females by age. Therefore, we will experiment with hypothetical functions which will approximate the real data.
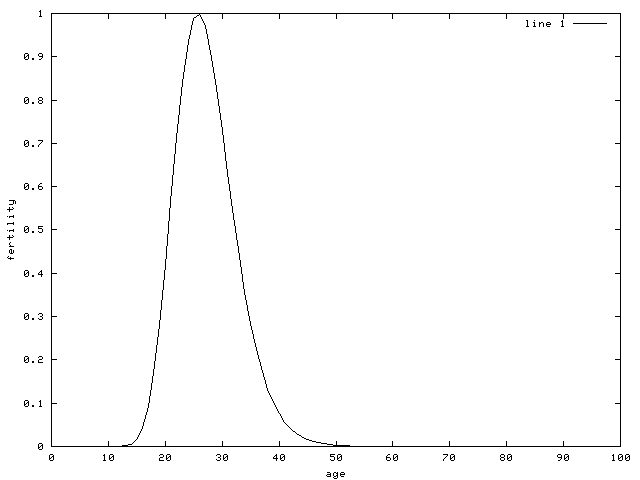
We will assume that the number of females born from the age group with average age x follows the log-normal distribution. More precisely, we will assume that if
Below is the plot of the fertility function with c=1
Note that you will need to scale the fertility vector so that the sum over all age groups is 1 exactly. This is necessary for the total population of females to remain constant.
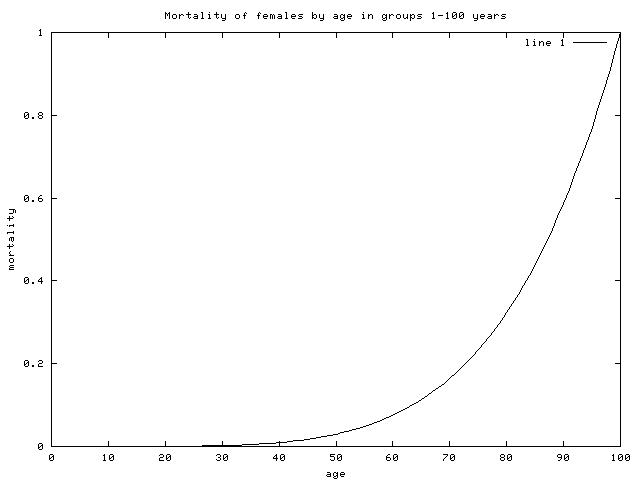
We will assume a simple power law:
Below is the plot of the mortality function
You need to build a Markov Chain model. Note that after a year a fraction of group j moves into group j+1 and a fraction "moves" into group 1.
You will need to set up the transition matrix and compute the equilibrium state. Please provide the plot of the equilibrium vector, as well as all sources that you use to generate it.The log-normal distribution has one extra term, so the distribution mentioned above is not exactly log-normal as the population is close to 0 or 100. Nevertheless, the fertility formula has clearly the desired shape.