We will work with data on the fat and protein content of items on the Burger King menu. The data are in a file named BKmenu.txt. Double-clicking on this should start a text editor (usually Notepad in Windows) with the data loaded. You will probably find it hard to work with. One strategy is to select everything and paste it into an empty Excel spreadsheet. Excel will usually separate it into columns and you can cut and paste one column at a time into the R data editor or use the scan() function. We will assume you have found some way to get the data into R. The command to get the regression equation and related information is not what you would expect. Here fat was the dependent variable and protein the independent variable. lm stands for linear model. By itself, it just returns the slope and intercept. The summary command tells it to return the summary table below.
> summary(lm(formula = fat ~ protein))

Call:
lm(formula = fat ~ protein)

Residuals:
    Min      1Q  Median      3Q     Max
-11.726  -8.772   1.239   7.029  20.052

Coefficients:
            Estimate Std. Error t value Pr(>|t|)
(Intercept)   6.4113     2.6466   2.423   0.0217 *
protein       0.9769     0.1212   8.057  5.4e-09 ***
---
Signif. codes:  0 '***' 0.001 '**' 0.01 '*' 0.05 '.' 0.1 ' ' 1

Residual standard error: 9.311 on 30 degrees of freedom
Multiple R-Squared: 0.6839,     Adjusted R-squared: 0.6734
F-statistic: 64.92 on 1 and 30 DF,  p-value: 5.402e-09
There is much more here than you really need so we have put the basic information in red. You can read off the regression equation as fat = 6.4113 + 0.9769*protein. R2 = 0.6839 = 68.39% and se = 9.311. The bad news is that fat tends to go up when protein content goes up (positive slope). The good news is that there is lots of scatter (R2 = 68.39% ) and so you may find exceptions.
You can also compute or graph the residuals.
> residuals(lm(formula = fat ~ protein))
          1           2           3           4           5           6
  4.2599876   7.3757304   3.6998103   6.8155532  -9.9946466  -7.9483495
          7           8           9          10          11          12
-10.6937153  -6.6011210  -6.5316753 -10.0872409   8.1442448 -10.7168638
         13          14          15          16          17          18
  6.9127591  -8.1566866   7.6812735   5.6812735  -0.2492808  -2.1335380
         19          20          21          22          23          24
  5.6349763  11.0285020   2.7275706  20.0516505  15.8896106   7.7275706
         25          26          27          28          29          30
 10.7275706   6.6349763 -10.1335380 -11.1103894 -10.1335380  -6.4113208
         31          32
 -8.3650237 -11.7261323
> plot(protein,residuals(lm(formula = fat ~ protein)))
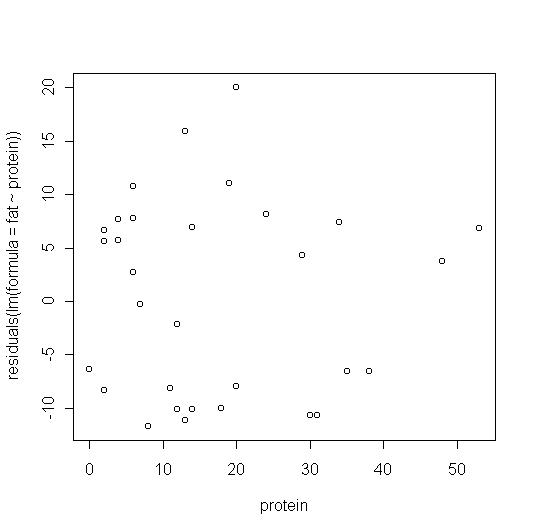
These look reasonably random but not clumped around zero. Instead there seems to be a group of residuals around 10 and another around -10.
If you plan to do much with the residuals, you may wish to store them in a variable for further work. For example, here they are stored in a variable res and then a histogram is made.
> res = residuals(lm(formula = fat ~ protein))
> hist(res)
The histogram is not reproduced here but it shows signs of the bimodality mentioned above.
© 2006 Robert W. Hayden