Downloading and installing the software is the hardest part. You may wish to rent a teenager for this. Because R runs on so many different platforms, the installation is not a "normal" one on any platform.
Go to the R home page http://www.R-Project.org and download and install the software for your platform. Information on doing this can be found at the website. Then get the manual for R-Commander and the installation instructions (which you can ignore unless you have problems).
Run R. You should get a Console window inside an Rgui window. In the Console window you should see something like
R : Copyright 2005, The R Foundation for Statistical Computing
Version 2.2.1  (2005-12-20 r36812)
ISBN 3-900051-07-0

R is free software and comes with ABSOLUTELY NO WARRANTY.
You are welcome to redistribute it under certain conditions.
Type 'license()' or 'licence()' for distribution details.

  Natural language support but running in an English locale

R is a collaborative project with many contributors.
Type 'contributors()' for more information and
'citation()' on how to cite R or R packages in publications.

Type 'demo()' for some demos, 'help()' for on-line help, or
'help.start()' for an HTML browser interface to help.
Type 'q()' to quit R.
The easiest way to install the R-Commander package if you have an active Internet connection, is via the Rgui Packages -> Install packages menu. The Rcmdr package and all missing packages on which it depends will be downloaded and installed. Select Packages -> Install packages, then pick a download source from the list, and Rcmdr from the very long list of free R add-ins. You will see a lot of stuff fly by as R downloads R-Commander, decompresses, and installs it. To activate it, type
library(Rcmdr)
at the R prompt:>
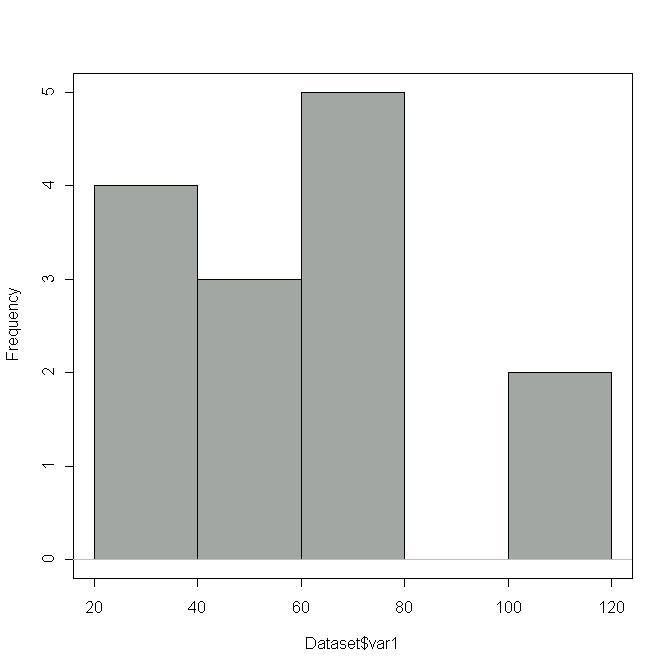
After a while, another window pops up. From its menu, select Data > New Dataset. Give the new file a name, click OK, and a spreadsheet-like window will open and you can type in your data. Close this window when you are done. From the R-Commander window, select Graph > Histogram. Though you only have one variable, you still have to click on it to select it. Click on the OK button and a histogram will pop up.
From the R-Commander window, select Graph > Stem-and-leaf display. The result will appear in the bottom half of the R-Commander window.
> stem.leaf(Dataset$var1)
1 | 2: represents 12
 leaf unit: 1
         n: 14

   3     3 | 266
   4     4 | 0
   6     5 | 27
  (2)    6 | 03
   6     7 | 1236
         8 |
         9 |
        10 |
   2    11 | 00
From the R-Commander window, select Graph > Boxplot
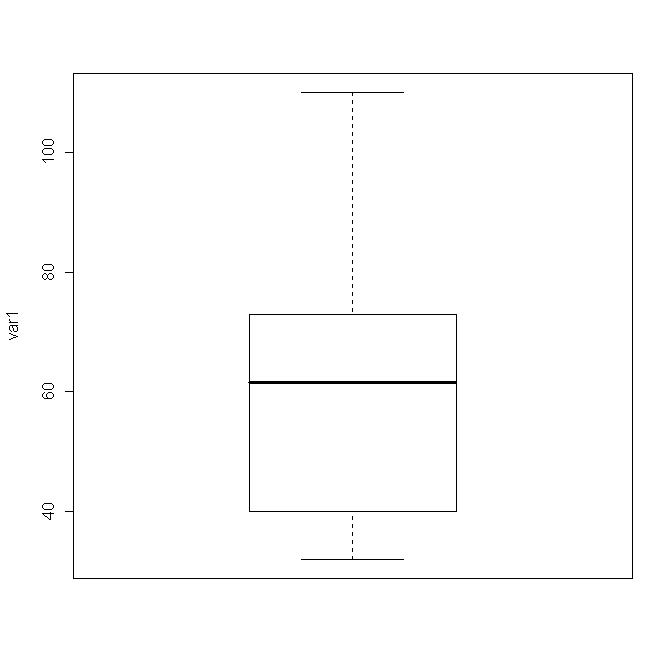
Once you have the data in R, you can get a variety of summary statistics. Try Statistics > Summaries > Active dataset
> summary(Dataset)
      var1
 Min.   : 32.00
 1st Qu.: 43.00
 Median : 61.50
 Mean   : 63.43
 3rd Qu.: 72.75
 Max.   :110.00
If you get different numbers, proofread your data for typos.
Try Statistics > Summaries > Numerical summaries
> mean(Dataset$var1, na.rm=TRUE)
[1] 63.42857

> sd(Dataset$var1, na.rm=TRUE)
[1] 24.71908

> quantile(Dataset$var1, c( 0,.25,.5,.75,1 ), na.rm=TRUE)
    0%    25%    50%    75%   100%
 32.00  43.00  61.50  72.75 110.00
Don't worry if you do not know what all these things mean. The last row gives the minimum, first quartile, median, third quartile and maximum value for this data. (There is not complete agreement on how to compute quartiles, so these may differ slightly from your textbook.)